在这篇文章写完后,我就有一个想法,可以和诸位一起语音交流解读下这些Lancet建议,所以临时想搞个学术交流会,有兴趣的朋友可以预约参加吧

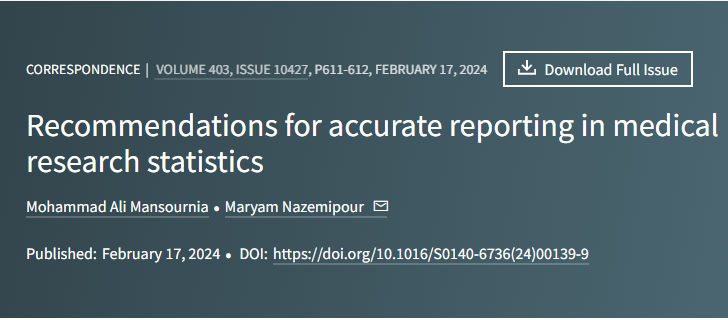
最新一期lancet发表了一篇关于医学论文统计学中常见错误的correspondence,写的很实用,摘译出来一起分享一下。这篇通信是基于对近三年投稿到《Lancet》的1000多份文章,总结出常见的统计误区,并为如何避免这些错误提供了指导。

准确报告统计数据的基本建议总结
使用均值和标准差(SD)(或中位数和四分位间距[IQR])描述定量数据的分布情况;
不要简单写P值小于或大于0.05(或0.01),要报告精确的P值;但对于极小的P值,可以报告为P<0.0001。
不要简单将结果描述为没有效果,除非区间估计的所有效应值均没有临床意义。
应基于临床重要性来解释结果。
根据背景信息(如因果有向无环图[DAG]所示)识别混杂因素,而不是统计学检验。
缺失数据的占比过高,可能会影响结果,不要简单删除不完整数据,可使用逆概率加权或多重插补等方法。
应使用专用的方法评估和处理稀疏数据偏倚(sparse-data bias)。
如果结局发生率较高,应报告危险比(risk ratio,RR)或危险差(risk difference,RD),而不是比值比(odds ratio,OR)
即使采用了相乘模型,也要评估相加交互作用。
1:描述性统计分析
Data description is crucial to making sense of data. The mean and SD are often used for the description of quantitative variables. Nonetheless, for highly skewed variables (eg, typical environmental exposures) the median and IQR should be used instead; for variables that take only positive values,mean<2,indicates serious skewness.
Full data descriptions also require histograms of continuous variables and tabulation of counts for categorical variables, along with percentages of missing data. Due to the volume of such descriptions, they can be given as supplementary material.
1:描述性统计分析
1.1 X±SD常用于描述定量变量,偏态分布资料采用中位数和四分位间距。
1.2 如果观察值全部是正值,且X/SD<2,提示严重偏态。
1.3 完整的统计描述还包括连续变量的直方图、分类变量的计数表、以及缺失数据的百分比,由于这部分内容较多,可在补充材料中给出。
郑老师:这里有一个建议界值:均数/标准差<2,提示严重偏态。我觉得不绝对,但如果均数/标准差<1,真的偏态分布了。
2. 统计模型尤其是线性的条件
All statistical analyses are based on fundamental assumptions, such as randomness of selection or treatment assignment. The validity of statistical modelling depends on further assumptions that should be assessed and, for this purpose, statistical tests are inadequate—graphical methods are needed. An important assumption underlying most regression models is linearity (on some scale) for quantitative predictors, which should be assessed with methods such as fractional polynomials or regression splines. In particular, categorisation of quantitative variables assumes an unrealistic step function, which can result in power loss or uncontrolled confounding.
所有的统计分析都基于基本假设,例如治疗分配的随机性;而统计模型的有效性取决于需要评估的进一步假设,仅有统计学检验是不够的,还需要图形。多数回归模型的重要假设是定量数据一定范围内呈线性,应使用分数多项式或回归样条等方法进行估计。
郑老师:这句话意思是:我们建立模型前提,需要一定前提条件,比如线性回归,要求线性、独立性、方差齐性、正态性的要求。
3. P值
Statistical inference remains heavily based on hypothesis testing and estimation. However, p values can provide useful information about the compatibility of data with statistical hypotheses or models and so should be reported precisely, not replaced by qualitative comments about being significant or not. Compatibility can be gauged through transformations of p values, called s values, based on coin-tossing experiments. Over-reliance on statistical testing should be avoided and p values should not be dichotomised at levels such as 0·05 or 0·01. In particular, large p values should not be interpreted as showing no association or no effect: absence of evidence is not evidence of absence.Only a very narrow interval estimate near the null value (0 for differences, 1 for ratios) warrants inferring that the study found no important association or effect. More generally, the clinical importance of results should be judged on the basis of interval estimates of appropriate measures, such as the difference of means or of risks.
统计学推断主要基于参数估计和假设检验。P值可以提供关于统计假设或模型相容性的有用信息,应精确报告P值,不应简单定性报告(即显著/不显著),即不要将P值简单报告为大于或小于0.05或0.01。要注意,P值大不应简单解释为无关联或无影响,缺乏证据不代表不存在[2]。除非区间估计接近零值,且区间非常窄,才可以推断为研究没有发现重要的关联或影响。一般情况下,还应根据合适指标的区间估计(如均数差或危险差)来判断结果的临床重要性。
郑老师:不要简单写P值小于或大于0.05或0.01,要报告精确的P值,但对于极小的P值,可以报告为P<0.0001。
4. 混杂因素控制
The research question for many studies is causality, for which confounding adjustment is crucial. Confounders should be selected on the basis of background causal information—eg, as depicted in a directed acyclic graph. Significance-based methodologies, such as stepwise selection algorithms, can be highly misleading because they could omit important confounders.
许多研究问题涉及因果关联,调整混杂因素至关重要。应根据背景因果信息(如因果有向无环图所示)来选择混杂因素。检验显著性的统计方法(如逐步选择法)可能会遗漏重要的混杂因素,产生较大的误导性。
郑老师:逐步回归法真的不推荐用来控制混杂偏移了。
5. 缺失数据处理
Missing data is common. Simple methods of handling missing data, such as complete-case analysis (ie, listwise deletion), missingness indicators, or last-observation-carried-forward, can be subject to considerable bias and should be avoided if the proportion of missing data is high (eg, >5%). Better methods include inverse probability weighting and multiple imputation, although these still depend on missingness being conditionally random.
数据缺失普遍存在,如果缺失数据的比例较高(>5%),应避免使用简单的缺失数据处理方法(如完整个案分析、末次观测值结转法),这些方法可能产生较大偏倚。更好的方法包括逆概率加权和多重插补,但这些方法也依赖于缺失是随机缺失。缺失数据的占比过高,可能会影响结果,不要简单删除不完整数据,可使用逆概率加权或多重插补等方法。
郑老师:我看到基本上国内的文章和毕业论都没有认真对待缺失数据,其实缺失数据处理并不是特别难。我们还做过系列讲座
视频回放:立春统计交流会“临床研究缺失数据如何处理”
6. logistic回归
An important source of bias in logistic or Cox regression is sparse data—ie, a low number of events in some combinations of levels of variables. Unrealistically large ratio measures with wide interval estimates (eg, an odds ratio >10 with limits of 2 and 50) indicate sparse-data bias, which can be reduced with penalised or Bayesian methods.When the dependent variable is an indicator of a common outcome, adjusted risk ratios are preferable to odds ratios for assessing clinical relevance, due to their ease of proper interpretation and resistance to sparse-data bias. Risk ratios and differences can be estimated in cohort studies and randomised trials with modified Poisson regression or regression standardisation.
稀疏数据(sparse data)是Logistic回归或Cox回归一个重要的偏倚来源。OR较大和置信区间较宽常提示存在数据稀疏偏倚,可以通过惩罚函数或贝叶斯方法减少偏倚。当因变量是一个常见结局的指标时,调整后的危险比RR(risk ratio)在评估临床相关性方面优于OR(odds ratio)。因前者更容易合理解释。在队列研究和随机对照试验中可使用改良的泊松回归或标准化回归系数来估计危险比(RR)和危险差(RD)
郑老师:modified Poisson regression我讲过,真的是一个好方法。
7:交互作用
Many studies try to examine interactions between two treatments on the outcome or want to estimate how much an effect of a treatment is modified by another variable (ie, effect-measure modification). Modellers often add product terms in the regression model such as logistic or Cox, which correspond to multiplicative interactions on the odds or rate scale. However, additive interaction on risks is more relevant for both clinical decisions and public health and so should be assessed as well.
In either case, studies will usually have little power to establish even the direction of an interaction and risk producing misleading estimates if they screen for interactions with statistical tests.
许多研究试图调查两种治疗方法的相互作用对结局的影响,或者想要估计一种治疗方法被另一种方法调整的程度(即effect-measure modification)。研究者常在回归模型(如logistic或Cox)中加入乘积项,但相加交互作用与临床决策和公共健康的相关性更大,也应该进行评估。
后记:
上面的很多内容,其实,郑老师我都在多个场合交流过。这篇文章也是一个总结性的建议了。
其实这些建议不难理解,各位平时在开展数据分析之前,可以对照下解读。
我想起来,可以比如我开一次专题讲座,来和各位讨论这一事宜。
回头见!
不用回头见了,我直接设定了时间哈哈!
全文点击阅读原文链接lancet网页。
本公众提供各种科研服务了!
一、课程培训
2022年以来,我们召集了一批富有经验的高校专业队伍,着手举行短期统计课程培训班,包括R语言、meta分析、临床预测模型、真实世界临床研究、问卷与量表分析、医学统计与SPSS、临床试验数据分析、重复测量资料分析、nhanes、孟德尔随机化等10余门课。如果您有需求,不妨点击查看:
发文后退款:2024-2025年科研统计课程介绍
二、数据分析服务
浙江中医药大学郑老师团队接单各项医学研究数据分析的服务,提供高质量统计分析报告。有兴趣了解一下详情:
课题、论文、毕业数据分析


